Splunk ES performance fundamentals (skipped searches)
When you have a busy Splunk environment with multiple apps, ES and custom correlation searches you need to make sure to optimize your configuration to best use your kit. Scheduling your searches and prioritizing them appropriately is usually step 1.
When you create a correlation search its important to configure the following parameters:
More detailed explanations as always in the manual here.
Having taken into consideration the latter, leaves the searches that run in Splunk due to installed apps, be that ES, CIM acceleration or other apps you have installed in your search head.
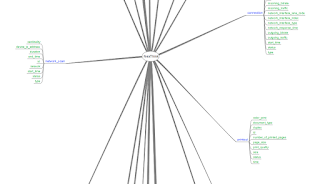
The scheduler is the source of very valuable information to illustrate what the situation looked like before and after.
Splunk search:

The reason field in the majority of those searches showed:
"The maximum number of concurrent auto-summarization searches on this instance has been reached" or "The maximum number of concurrent historical scheduled searches on this instance has been reached"
To get more detail on the issue I used the following:

To fix the issue there are two options:


When you create a correlation search its important to configure the following parameters:
- Cron Schedule
- You can randomize the run times yourself here 2,22,42 * * * * (for a 20m search)
- Scheduling
- Continuous is less intensive than Real-time
- Schedule Window
- auto is my preferred option here
- Schedule Priority
- Usually preferred option is Higher (which makes it fifth overall in the priority order which you can see here)
More detailed explanations as always in the manual here.
Having taken into consideration the latter, leaves the searches that run in Splunk due to installed apps, be that ES, CIM acceleration or other apps you have installed in your search head.
The scheduler is the source of very valuable information to illustrate what the situation looked like before and after.
Splunk search:
index=_internal sourcetype=scheduler source="/opt/splunk/var/log/splunk/scheduler.log" savedsearch_name="*" status!="continued" host="<your_search_head_hostname>" | timechart count by status

The reason field in the majority of those searches showed:
"The maximum number of concurrent auto-summarization searches on this instance has been reached" or "The maximum number of concurrent historical scheduled searches on this instance has been reached"
To get more detail on the issue I used the following:
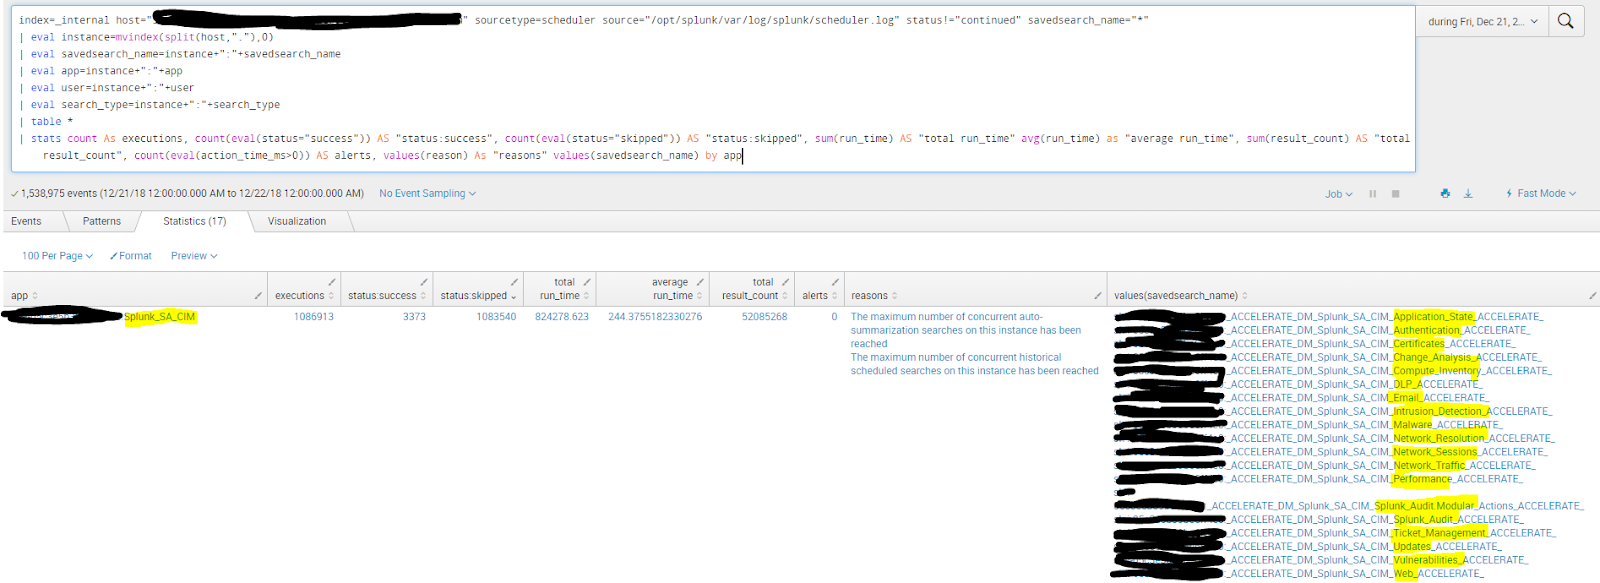
index=_internal host="<your_search_head_hostname>" sourcetype=scheduler source="/opt/splunk/var/log/splunk/scheduler.log" status!="continued" savedsearch_name="*"The above will produce the following, which highlights that the Acceleration searches performed in the background for the highlighted data models are very inefficient. The searches in question have been successful 3373 times in 24h but have been skipped 1086913 times in the same time.
| eval instance=mvindex(split(host,"."),0)
| eval savedsearch_name=instance+":"+savedsearch_name
| eval app=instance+":"+app
| eval user=instance+":"+user
| eval search_type=instance+":"+search_type
| table *
| stats count As executions, count(eval(status="success")) AS "status:success", count(eval(status="skipped")) AS "status:skipped", sum(run_time) AS "total run_time" avg(run_time) as "average run_time", sum(result_count) AS "total result_count", count(eval(action_time_ms>0)) AS alerts, values(reason) As "reasons" values(savedsearch_name) by app
To fix the issue there are two options:
- Disable acceleration to the data models that you are not using (keep in mind that dashboards based on those data models will stop working!)
- Restrict data models to particular indexes.
- Under each data model's configuration a macro is used to identify the indexes to be queried for that data model's relevant data.

In order to identify the relevant indexes for this case you can run the following query for the past 7 days (in fast mode) or longer if you want to be 100% certain you have all the data:
tag=change | stats values(index) as index
The result will be a small list of indexes you can add to the cim_Change_Analysis_indexes macro found under Settings -> Advanced search -> Search marcos (search with app context all and owner any to be sure). The result should look something like this:

When you have completed the above process for all the data models you will eventually see the following result in skipped searches:
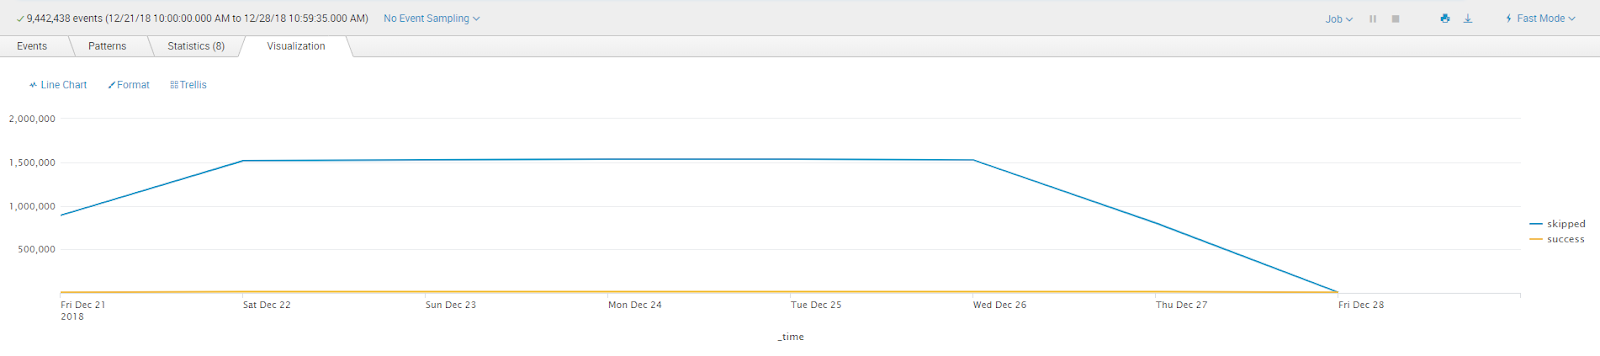
From 1524947/day to 6279/day.
I'd call that a win.
Hope this helps.